Measuring translation difficulty:
An empirical study
Sanjun Sun & Gregory M. Shreve
Target, 26(1), 98-127Abstract : The purpose of this study was to find a method to measure difficulty in a trans lation task. Readability formulas have been suggested to be a useful tool and yet this needs to be empirically tested. In this study, NASA Task Load Index, a multidimensional scale for measuring mental workload, was used to assess the level of translation difficulty for the translator. It was found that a text’s readabil ity only partially accounts for its translation difficulty level. Translation quality score was found to be an unreliable indicator of translation difficulty level, while time-on-task was significantly, but weakly, related to translation difficulty level. A formula was developed to predict a text’s translation difficulty level for a trans lator by using the translator’s pre-translation rating.
Keywords: translation, difficulty, empirical workload, cognitive, readability, competence, measurement, method
1.INTRODUCTION
Knowing the difficulty level of a translation assignment is important in transla tion pedagogy, accreditation and research, as well as for the language industry. For instance, in process-oriented translation research, researchers have no standards to refer to when they choose test passages, and the texts used are diverse in terms of text type, length and, possibly, difficulty (see Krings 2001, 74). This makes it hard for one to evaluate the comparability of experimental results between these studies. For example, the use of different translation strategies in terms of type and frequency might vary depending on the translation difficulty level of the texts. Dragsted (2004) found in her empirical study that professional translators would adopt a more novice-like behavior during the translation of a difficult text than during the translation of an easy text. Thus, translation difficulty is an important variable in translation process research.
Traditionally, people rely on their holistic intuition to gain an idea of the level of a text’s translation difficulty. Although experts’ intuition (especially an expert panel’s judgment) is “reasonably reliable” (Campbell and Hale 1999), we still need instruments or established procedures to make the evaluation process more ef fective and the results more objective. Eventually, an application for measuring translation difficulty can be developed.
From the cognitive perspective, difficulty refers to the amount of cognitive ef fort required to solve a problem. Difficult tasks need more processing effort than easy ones. Translation difficulty can be viewed as the extent to which cognitive resources are taken up by a translation task for a translator to achieve objective and subjective performance criteria. Difficulty is similar to complexity, but the two are not the same. According to Dahl (2004, 39), difficulty is a notion that primarily applies to tasks, and is always relative to a person, hence the term ‘task difficulty’; complexity as an information-theoretic notion is more objective, and can be com puted mathematically. Complexity is an important component of difficulty.
Two concepts similar to difficulty are mental workload and cognitive load. The former has been an important concept in the field of human factors and ergonom ics (see, e.g., Moray 1979; Tsang 2006), while the latter thrives in a field called “cog nitive load theory” which originated from the studies of human learning during performance of problem-solving tasks (see, e.g., Sweller et al. 2011). The two fields (especially mental workload) can contribute significantly to the study of transla tion difficulty.
Although the expression ‘translation difficulty’ has been mentioned frequent ly in translation literature (e.g., Nord 2005), few researchers have attempted to measure translation difficulty. Campbell and Hale (e.g., 1999; see also Hale and Campell 2002), Jensen (2009), and Liu and Chiu (2009) are among the few re searchers who have done some exploratory empirical work in this direction. Campbell and Hale (2003) argue that it is possible to compile an inventory of uni versal sources of translation difficulty in source texts as well as lists for specific language pairs. In the field of reading, by contrast, researchers have been working on readability formulas for measuring text readability since the 1920s (for an over view, see Zamanian and Heydari 2012).
It has been suggested by translation researchers (e.g., Jensen 2009) that read ability formulas can be used to measure a text’s level of translation difficulty. A readability formula is an equation which combines the statistically measurable text features that best predict text difficulty, such as average sentence length in words or in syllables, average word length in characters, and percentage of dif ficult words (i.e., words with more than two syllables, or words not on a particu lar wordlist). These formulas use one to three factors with a view to easy manual application. Among these factors, vocabulary difficulty (or semantic factors) and
sentence length (or syntactic factors) are the strongest indexes of readability (Chall and Dale 1995). The translation process, as one might say, consists of reading and reverbalization (e.g.,Wilss 1982), and the sources of translation difficulty include text difficulty, translation-specific difficulty (e.g., non-equivalence, one-to-several equivalence, and one-to-part equivalence situations as mentioned by Baker ([1992] 2011), and translator factors (i.e., the individual’s cognitive capabilities, and past experience and training). So how could one use a readability formula to measure translation difficulty? The reason why a readability formula might work for measuring translation difficulty is that many language features are correlated. Difficult passages that express difficult, abstract ideas tend to contain hard words, while easy passages dealing with familiar, concrete ideas tend to use familiar words (Rayner and Pollatsek 1989, 319). In addition, according to Zipf’s law (Zipf 1935), word frequency and word length are inversely related, i.e., short words occur with high frequency while longer words occur with lower frequency as a result of a biological principle of least effort. Thus, the use of readability formulas for measuring a text’s level of translation difficulty cannot be simply dismissed and has to be empirically tested.
If tests show that readability formulas cannot be used to predict the translation difficulty level of a text, then a model needs to be developed for this purpose. In order to test the effectiveness of readability formulas or develop a model to predict a text’s level of translation difficulty, we first must know how to measure translation difficulty. The development process of readability formulas will give us some guide in this regard.
According to Klare (1984, quoted in Anagnostou and Weir 2007, 6), the steps to produce a readability formula are:
- Choose (or develop) a large set of criterion-text passages of varied content and measured difficulty (typically, comprehension) values.
- Identify a number of objectively stated language factors.
- Count the occurrences of the language factors in the criterion passages and correlate them with the difficulty values of the criterion passages.
- Select the factors with the highest correlations as potential indexes of readability.
- Combine the indexes, using multiple regression techniques, into a formula.
- [Optional] Cross-validate on a set of new criterion passages.
Regarding the first step, reading researchers’ methods for obtaining the reading difficulty value of a passage include performance measures and subjective measures, which will be detailed shortly. The procedure for developing a model to predict a text’s level of translation difficulty, in other words, is that we measure language features (such as lexical complexity, syntactic complexity, and cohesion)
using text analysis tools, and test translators using texts whose language features have been described; then, multiple regression, a statistical technique for estimating relationships between variables, can be used to see which language features are correlated with translators’ objective performance and their subjective evaluations of translation difficulty.
Two commonly used performance indicators are speed (i.e., time-on-task) and accuracy (i.e., number of errors). They have been proved to show sensitivity to workload manipulations (see O’Donnell and Eggemeier 1986, 21). Readability formula developers typically focus on accuracy, and their most frequently used performance measure for deriving the reading difficulty values of test passages is the cloze procedure developed by Taylor (1953). Cloze test developers delete every fifth word from a passage and ask readers to accurately guess the word that belongs in each blank. The cloze score is the number of exact word replacements divided by the number of deleted words, expressed as a percentage. Obviously, the cloze procedure does not work in our case, but we can adopt the time-on-task and number-of-errors indicators.
Subjective measures have been very frequently used to evaluate mental workload mainly because of their high face validity and easy implementation (Vidulich 1988), and the most commonly used subjective measure is the rating scale. The rationale for using subjective measures is that increased capacity expenditure will be associated with subjective feelings of effort or exertion that can be reported accurately by the participant unless the workload is beyond what the participant can handle (O’Donnell and Eggemeier 1986, 7). Over the decades, rating scales have proven to be valid, sensitive, non-intrusive measures of workload that enjoy a high degree of acceptance among the participants and require minimal instrumentation (Wilson and Eggemeier 2006). Among the subjective rating scales designated specifically for assessing workload, the most frequently employed and evaluated with respect to their reliability, validity and sensitivity to change in workload are the NASA task load index (TLX), the subjective workload assessment technique (SWAT), and the Cooper-Harper scale (MCH) (Wilson and Eggemeier 2006).
Based on 16 different experiments with different kinds of tasks, Hart and Staveland (1988) developed NASA-TLX (Task Load Index), which includes six workload-related subscales, as follows:
- Mental Demand: How much mental and perceptual activity was required (e.g., thinking, deciding, remembering, searching, etc.)? Was the task easy or demanding, simple or complex, exacting or forgiving?
- Physical Demand: How much physical activity was required (e.g., pushing, pulling, etc.)?
- Temporal Demand: How much time pressure did you feel due to the rate or pace at which the tasks or task elements occurred?
- Effort: How hard did you have to work (mentally and physically) to accomplish your level of performance?
- Performance: How successful do you think you were in accomplishing the goals of the task set by the experimenter (or yourself)? How satisfied were you with your performance in accomplishing these goals?
- Frustration Level: How insecure, discouraged, stressed and annoyed versus secure, gratified, content, relaxed and complacent did you feel during the task?
Each subscale is presented as a line divided into 20 equal intervals anchored by bipolar descriptors (e.g., low/ high, good/poor), as shown in Figure 1:
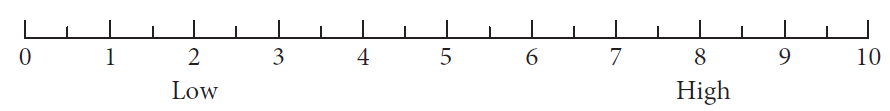
Figure 1. A NASA-TLX subscale
In the field of cognitive load theory, a well-known and extensively used subjective rating scale is a 9-point Likert scale first used by Paas (1992). This scale ranges from “very, very low mental effort” (1) to “very, very high mental effort” (9). Later studies show that this simple subjective rating scale has been shown to be a very “sensitive measure available to differentiate the cognitive load imposed by different instructional procedures” (Sweller et al 2011, 74).
Sometimes, conflicting results from multiple measures arise. For instance, several studies in the field of cognitive load theory found a cognitive load difference based on subjective measures but no group treatment effect on performance measures (see Sweller et al 2011, 75). In this case, we can follow Jex’s (1988, 14) suggestion that “the fundamental measure, against which all objective measures must be calibrated, is the individual’s subjective workload evaluation in each task.”
This study focused on the following five research questions: 1) whether NASATLX (Task Load Index) is a reliable subjective metric for measuring translation difficulty, 2) whether translation quality scores (i.e., accuracy) as a performance indicator can be used to measure or represent translation difficulty, 3) whether time on task (i.e., speed) as a performance indicator can be used to measure or represent translation difficulty, 4) whether Flesch Reading Ease formula (or readability formulas in general) can be used to predict a text’s level of translation difficulty, 5) how we can know a text’s level of translation difficulty for a translator without having the text translated first.
2. Methods
2.1 Participants
Forty-nine third-year undergraduate students in translation/English from a university in Shandong Province, China, and 53 first-year graduate students in translation (including 41 from a university in Beijing and 12 from that university in Shandong Province) participated in this study during May and September 2011. Each group was homogeneous in terms of age and years of English learning and translation training experience. None of them worked as professional translators. They all spoke Mandarin Chinese as their first language, started learning English as a foreign language from the 6th grade, and had had classes in translation theory and practice.
All participants took part in this study on a voluntary basis. Each participant received a pen, correction tape, and a notebook or stopwatch as remuneration for their time.
2.2 Materials
The test materials included short passages to be translated from English into Chinese, and pre-translation and post-translation ratings.
Test passages
Fifteen passages were used in this study. They were all informational and expository texts, e.g., “How to Avoid Germs in Public.” Most of them were from eHow. com and About.com. Their lengths ranged from 121 to 134 words.
The reason for using informational texts was threefold. First, informational texts “comprise the majority of reading and writing done by adults” (Hoyt et al. 2003, 1). Second, it is difficult to find self-contained short narrative or literary passages. Third, taking into account the text type variable would require a larger sample of text passages in this study, and thus all texts were of the same text type.
Fifty passages in the pool were measured using the Flesch Reading Ease formula, which is one of the most popular and influential readability formulas (DuBay 2004). Depending on their Flesch Reading Ease scores, passages in the scope of
70–80 belonged to the Easy group; those in the scope of 46–55, Medium group; those in the scope of 20–30, Difficult group. The three groups would be compared in later analysis. As measured by the Flesch–Kincaid Grade Level, a score of 85 corresponds to a 5th grade level, while below 30 is graduate school level.
In order to locate the subject matter and terminology challenges that participants might not be able to handle even with a general English-Chinese dictionary, the first author translated the prospective texts in the three reading difficulty groups, and narrowed down the number of eligible passages to 15.
A software program called Readability Studio (version 3.2.7) was used to analyze the readability of the 15 English source texts. This program contains many popular readability formulas, such as Flesch Reading Ease, Flesch-Kincaid, New Dale-Chall, and SMOG. It can calculate the number of sentences, average sentence length, number of difficult words, etc.
Translation ratings
The pre-translation rating asked participants to predict the translation difficulty level of the passage they just read but had not started to translate on a 0–10 Likert scale with 0 being extremely easy and 10 being extremely difficult (as shown in Figure 2).
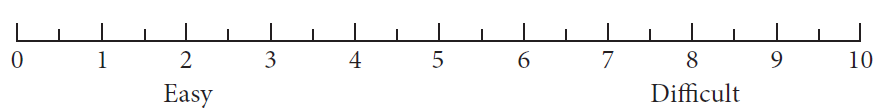
Figure 2. The pre-translation rating
The post-translation ratings had two parts. The first part was a short survey, addressing how much time they spent on the translation, which of the two (i.e., source text comprehension and reverbalization in the target language) was more difficult for them, which aspects in source text comprehension (i.e., lack of background knowledge, too many difficult words, sentences too long, and others) created more problems for them, and which aspects in reverbalization (i.e., words, sentences, style, and others) created more problems for them. For the details see Appendix A.
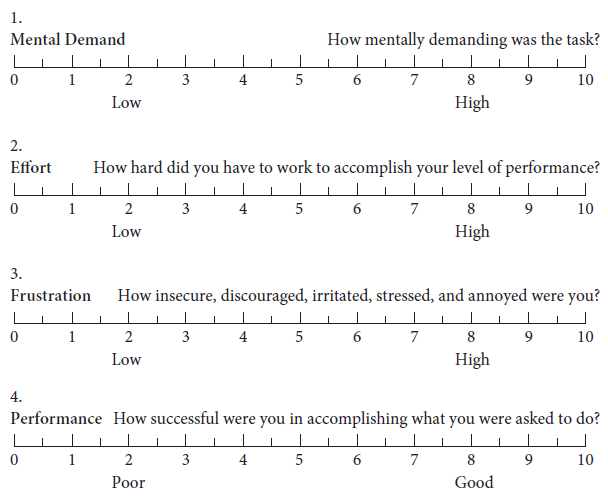
The second part was adapted from NASA-TLX to evaluate subjective workload. Four categories were used, including Mental Demand (i.e., was the task easy or demanding, simple or complex), Effort (i.e., how hard did you have to work to accomplish your level of performance), Frustration level (i.e., how insecure, discouraged, irritated, and stressed did you feel during the task), and Performance (i.e., how satisfied were you with your performance). The categories “physical demand” and “temporal demand” were not used as they were not applicable, or they were just given a weight of 0. For the details see Appendix B.
2.3 Design and procedure
Experimental design
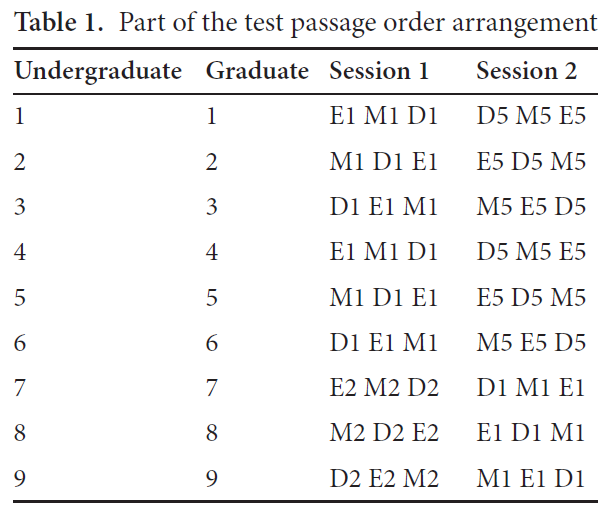
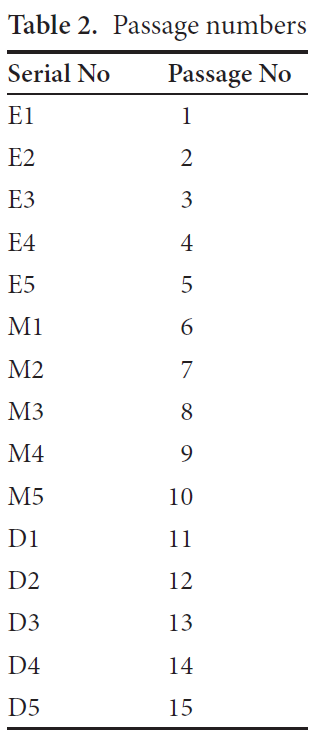
Each participant translated 6 passages (2 Easy, 2 Medium, and 2 Difficult) on paper in two sessions with a week’s interval between them. In each session they translated 3 passages (one Easy, one Medium, and one Difficult). The order in which they translated the passages was counterbalanced using a Latin square design. Tables 1 and 2 present part of the test passage order arrangement:
Test procedure
At the beginning of the first session, participants were given brief instructions, and they signed the Informed Consent/Release Form approved by the university research ethics review board. Then three envelopes were given to each participant. Two of the envelopes had “For Session 1” and “For Session 2,” respectively, and a serial number on the outside. Each of the two envelopes contained three passages in accordance with the test passage order arrangement, and each passage was printed on a page by itself. The third envelope was for holding the finished evaluation sheets and translations. After the participants wrote down their names on the three envelopes, the “For Session 2” envelopes were gathered by the tester for use in the second session.
Participants were requested to take out one passage from the envelope at a time. The following procedure was followed:
- Participant reads the first passage.
- Participant does pre-translation rating and puts the pre-translation form into the third envelope.
- Participant translates the passage.
- Participant does post-translation rating, and places the passage, translation and rating in the third envelope.
- Participant takes out the second passage.
- Back to step 1 until the three passages are all completed.
The test passages were carefully folded so that participants would not know the contents of other passages they had not opened. They were not allowed to go back into the third envelope to work on a previous translation or rating.
Participants were told beforehand to bring their own dictionaries to the test. The translation brief was that their translations would be published in the school newspaper. There was no time constraint. If there were a time constraint, participants would not pay enough attention to the questionnaires, and it would violate some statistical tests’ assumptions. For instance, internal consistency reliability, which can be for checking a rating scale’s internal consistency, is not an appropriate reliability estimate if the test is characterized as a speeded test (Chen and Krauss 2004a, 502).
Grading the translations
Participants’ translations were manually keyed verbatim into the computer by the first author and several helpers, and then double-checked by the first author. Compared with handwritten translations, an electronic version presents no illegibility problems (which exist in handwritten translations though they are pretty rare) and improves data quality. In the professional world, no translator translates
on paper, and the translator’s handwriting has nothing to do with translation quality. More importantly, the graders would not be influenced by the participant’s handwriting. All translations were uniformly formatted so that the format would not be a factor influencing translation assessment.
In this study, participants’ translations were evaluated by three independent graders, all of whom had translation teaching experience and had translated at least two books. The graders were requested to use both holistic and analytic methods. To facilitate grading and analysis, a software program called TransGrading (see www.transgrading.com, 22 February 2012) was used. It allows the user to use holistic and/or analytical scoring methods; the error category list and holistic category list are customizable; it can calculate error deduction points and total scores, and export errors, error deduction points, and total scores to Microsoft Excel for further analysis. The error category list used in this study was based on the ATA (American Translation Association) error category list with some modifications tailored for English-Chinese translation. The graders were required to identify translation errors and then assign 1, 2, 4, 8, or 16 points to each error. The holistic score for each translation was from 0 to 10, with 0 indicating a poor translation and 10 indicating an excellent translation. Only integer scores were used.
The graders first used the analytic method, identified a mistake and assigned a point to it. They didn’t need to add up the points deducted as the software program could do it. Then they read the whole translation quickly and gave a holistic grade.
Calculating interrater reliability
Graders often do not assign the same grades to the same translations, partly because people have different ideas about what exactly constitutes translation quality (e.g., House 2009). In order to test whether the graders were consistent and their ratings were generalizable to other graders, the interrater reliability among the graders needed to be determined.
Cronbach’s alpha for the current study was .98, much higher than the threshold value .70. Mean for individual translations was 7.48, variance = 1.36, and range = 6.67. This indicates that the three graders were consistent and their ratings were highly reliable. The graders’ ratings of each translation were then averaged, and the average was taken as the translation’s quality score.
Checking for normality
As most statistical procedures (e.g., t-tests, analysis of variance, tests for regression coefficients) begin with the assumption of the normal distribution to make inferences about the population based on the sample, skewness and kurtosis were used to test whether a distribution was a normal distribution. It was found that there was no violation of the normality assumption in this study.
3. Results
3.1 Checking NASA-TLX’s reliability
As scales are reliable with some groups but may be unreliable with other groups (Pallant 2011), it is necessary to check their reliability. This is especially so in this case for two reasons. First, NASA-TLX has not been used to evaluate readability or translation difficulty. Second, only four of its six subscales (i.e., mental demand, physical demand, temporal demand, satisfaction in performance, effort, and frustration level) were adopted in this study.
Reliability concerns “the relative amount of random inconsistency or unsystematic fluctuation of individual responses on a measure” (Chen and Krauss 2004b, 952). A major type of reliability is internal consistency reliability, which refers to the degree to which the items on a scale are all measuring the same underlying construct. Cronbach’s Alpha (Cronbach 1951) is the most commonly used measure of internal consistency reliability. It measures the average correlation among all of the items that make up the scale, and produces values between 0 and 1, with a higher value indicating a higher degree of internal consistency. The generally accepted minimum Alpha coefficient is .70 (Nunnally 1978). In this study, as 15 source texts were used and participants translated different source texts, the Alpha coefficient for each passage was calculated using SPSS (version 20). The Alpha Coefficient of the 15 passages turned out to range from .71 to .86, and the average was .77. This indicates a satisfactory degree of NASA-TLX’s internal consistency. The coefficient of .77 means that the four items constituting the scale accounted for 77% true measurement of workload among the participants.
As a result, the total of the scores on the four subscales can be the translation difficulty score. Alternatively, the average of the scores on the four subscales can be taken as the translation difficulty score so that the range of translation difficulty scores will be 0–10.
3.2 Translation difficulty level and translation quality score
In this section, the major research question is whether translation quality scores can be used to measure or represent translation difficulty.
A correlation analysis between translation difficulty score and translation quality score was conducted. It was found that translation difficulty score was negatively and weakly correlated to translation quality score, r(607) = −.12, p <.01. This indicates that the lower the translation difficulty score, the higher the translation quality score. However, this relationship was almost negligible. The value of R2 was .015, and it means that translation quality score could only account for
1.5% of the variation in the translation difficulty score and 98.5% of the variation in translation difficulty score could not be explained by translation quality score. Figure 3 shows a scatterplot of this correlation:
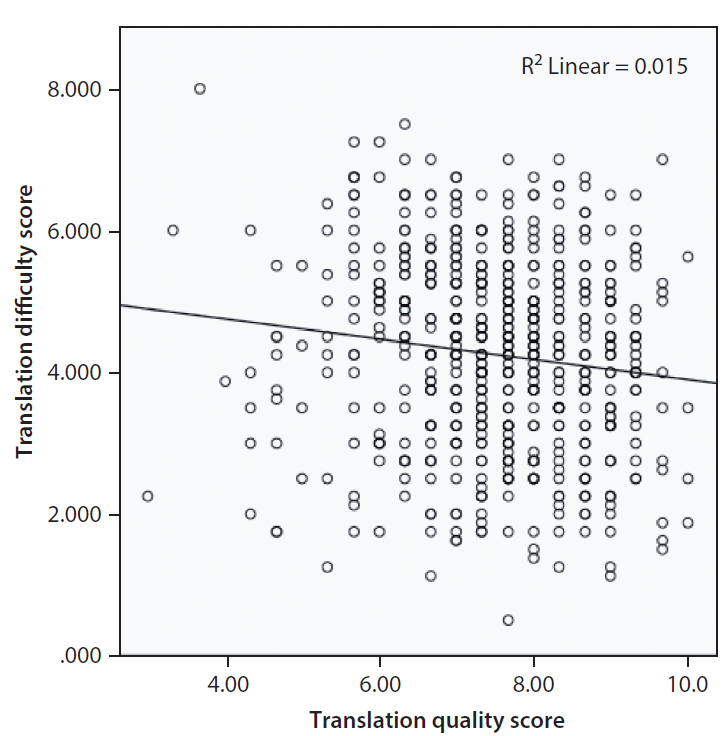
Figure 3. Correlation between translation quality score and translation difficulty score
As mentioned earlier, the participants in this study included 49 third-year undergraduate students in translation/English and 53 first-year graduate students in translation. Although it was tempting to equate graduate students with good translators, and undergraduate students with poor translators, it was necessary to look more closely into how undergraduate and graduate students performed in each of the 15 passages.
An independent-samples t-test was carried out on each passage. For each passage, on average, 20 undergraduate students and 20 graduate students did the translation. The null hypothesis was that there was no significant difference in translation quality score between undergraduate and graduate students. The alternative hypothesis was that either graduate students or undergraduate students performed better than the other group. The significance level (alpha level) was .05. The result was that undergraduate students (M = 7.63) outperformed graduate students (M = 7.38), and graduate students performed better than undergraduate students only in passages 1 (Easy), 6 (Medium), and 11 (Difficult). None of the pvalues was below .05. Therefore, there was no significant difference in translation quality score between the undergraduate and graduate students.
Thus, the participants’ performance (i.e., their translation quality score) was used to classify them into two groups: high scorer group and low scorer group. Although the two groups may comprise the top and bottom 50% of scorers, researchers in the field of test development and other fields often take the upper 27% of the scorers as the high-ability group and the lower 27% as the low-ability group (see Kelley 1939; Feldt 1961). This sampling method is called the extreme groups approach, and it is often used to achieve greater statistical power in subsequent hypothesis tests (Preacher et al 2005, 178). In this study and for this research question, the upper and lower 27% of the scorers on each of the 15 passage were put in the high scorer group and low scorer group, respectively.
Figure 4 presents the mean self-assessed translation difficulty scores of high and low scorers in each of the 15 passages. We can see that the two lines are intertwined. This means that the translation difficulty level evaluated by good translators is not consistently lower or higher than that by poor translators.
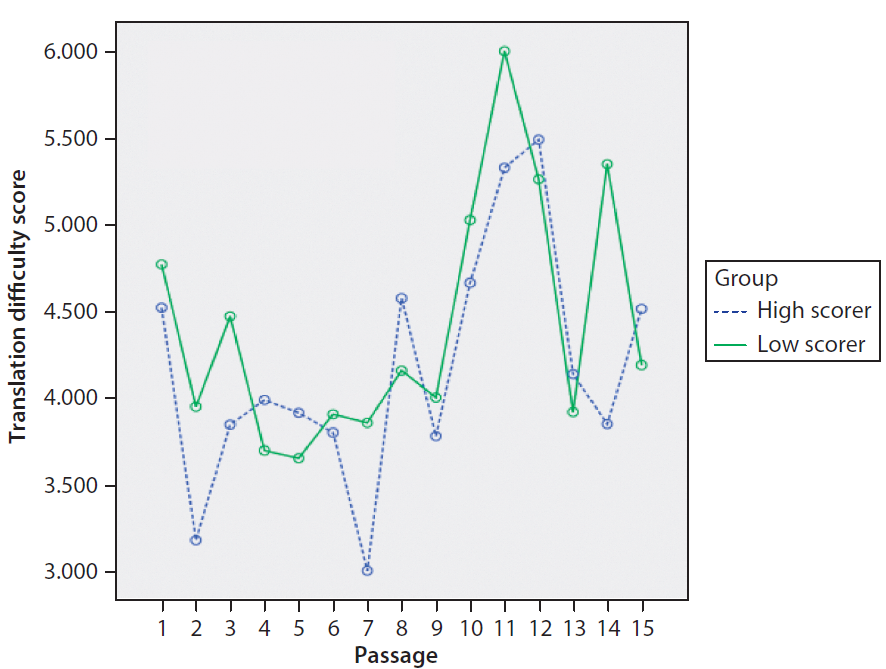
Figure 4. High scorers vs. low scorers in translation difficulty score
To sum up, translation difficulty score and translation quality score are different, and translation performance cannot be used to measure or represent translation difficulty (or workload).
3.3 Translation difficulty level and time on task
Translation researchers (e.g., Jääskeläinen 1996) have been wondering whether longer time spent on a translation is associated with better translation quality. Hence, there is a need to test whether time-on-task is correlated with translation quality score or translation difficulty level.
Two correlation analyses were conducted. The correlation analysis between time spent on a translation and translation quality score showed that the two were not significantly related, r(598) = −.05, p >.05. This means that longer time spent on a translation was not associated with better translation quality. High performers may finish a translation faster than low performers.
In the second correlation analysis, it was found that time spent on a translation was significantly, but weakly, related to translation difficulty level, r(598) =.29, p <.001. Figure 5 shows a scatterplot of this correlation. We can see that as translation difficulty level increased, participants tended to spend more time on the translation. However, this relationship was weak. The value of R2 was .086, and it means that time spent on a translation could only explain 8.6% of the variation in the translation difficulty score.
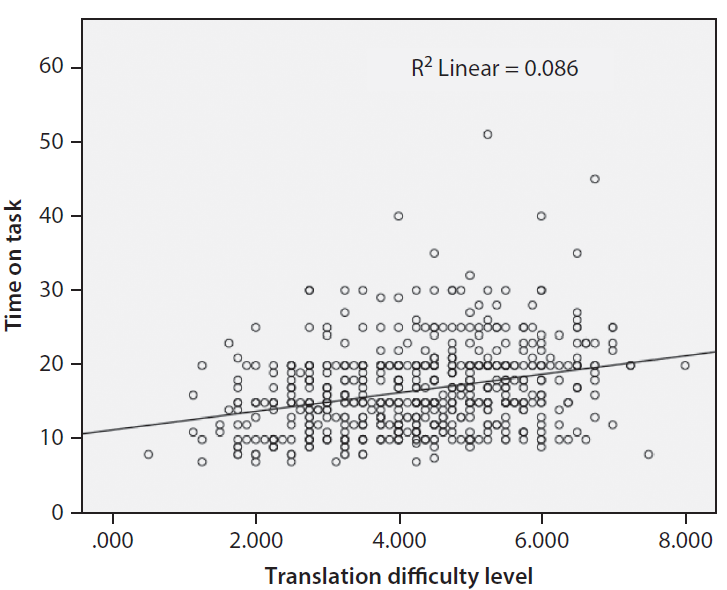
Figure 5. Correlation between translation difficulty level and time-on-task
3.4 Translation difficulty level and text readability
As mentioned previously, readability formulas might be able to be used to predict the translation difficulty level of a passage. There are many readability formulas. Based on their Flesch readability scores, the source texts used in this study
were divided into three categories: Easy (72–80), Medium (46–53), and Difficult (21–30). The three categories were clearly separated. As it is hard to prove that Flesch can be used to measure translation difficulty, the falsification approach was adopted. If the ranking of the three categories based on Flesch is different from the ranking based on translation difficulty score, then it can be concluded that Flesch cannot be used to measure translation difficulty.
The descriptive statistics for the three passage categories are presented in Table 3. We can see that on average, passages in the Difficult category (M = 4.66) were much more difficult to translate than passages in the other categories, and passages in the Medium category (M = 4.06) were slightly more difficult to translate than passages in the Easy category (M = 4.04). The ranking of the three categories based on Flesch was the same as the ranking based on translation difficulty score. As there are only slight differences in the results produced by different readability formulas, and the three passage categories were clearly separated in readability level, using a different readability formula would probably produce the same ranking. Therefore, the hypothesis that a readability formula can be used to measure translation difficulty could not be falsified.
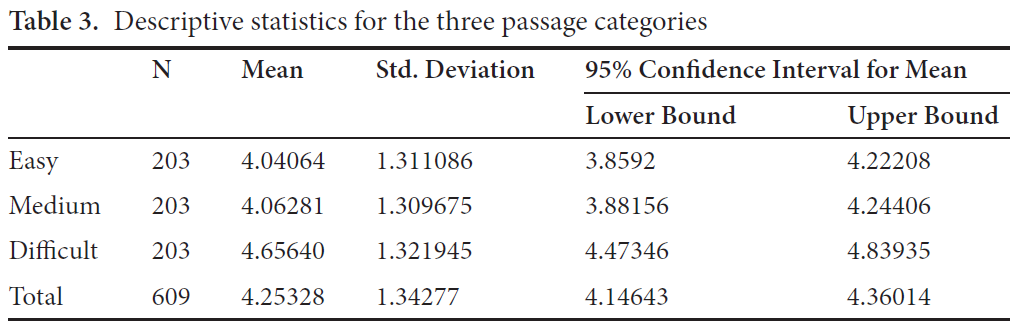
Figure 6 depicts how translation difficulty score varies as a function of the Flesch score. On the x-axis are the Flesch scores for the 15 passages. The readability level is from low to high. We can see that passage 11 (whose Flesch score is 21), whose readability level is the lowest, is associated with the highest translation difficulty level, while passage 5 (whose Flesch score is 80), whose readability level is the highest, has a relatively low translation difficulty score.
A correlation analysis between translation difficulty score and Flesch score was carried out. The relationship between the two was found to be negatively and weakly related, Kendall tau-b = −.141, N = 609, p < 0.001. This indicates that as the readability level increases, translation difficulty score tends to decrease. However, the correlation coefficient was very small.
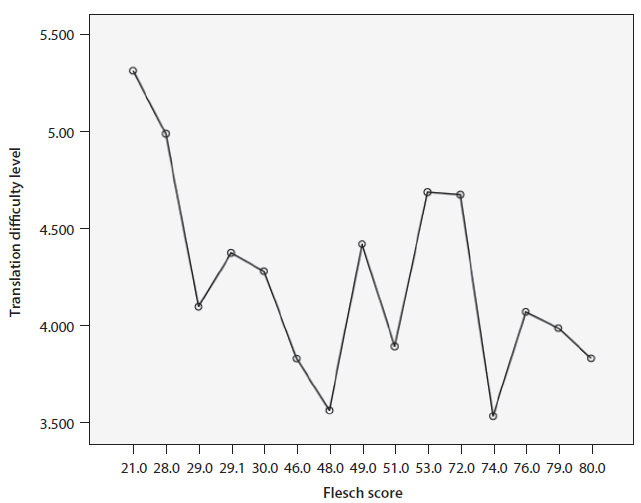
Figure 6. Translation difficulty score as a function of the Flesch score
3.5 Predicting the level of translation difficulty of a text
In the previous section, readability formulas based on average sentence length and percentage of difficult words were shown to be weakly correlated to translation difficulty level. This means that average sentence length, word difficulty, and other statistically measurable factors might be useful to measure or predict the translation difficulty level of a text.
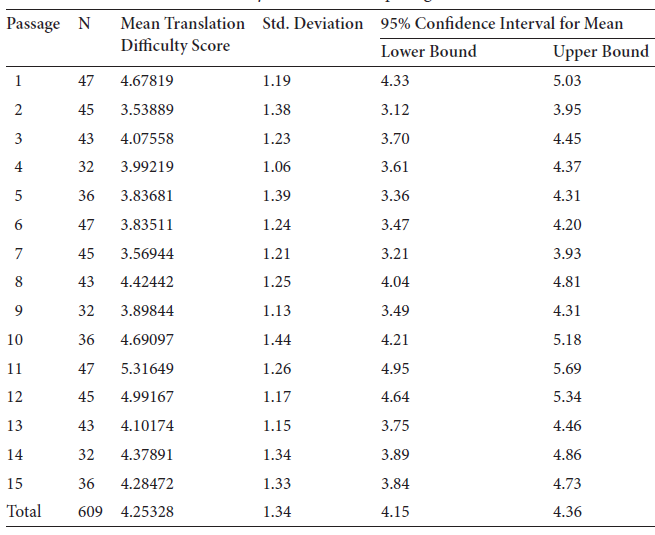
In this study, 15 test passages were used, and their mean translation difficulty scores assessed by the participants are as follows (see Table 4).
In order to develop a model (i.e., an equation) for predicting a passage’s translation difficulty level, multiple regression analysis (see, e.g., Pedhazur 1997) is needed. According to Green (1991), the minimum sample size for multiple regression analyses is 50 + 8 x (number of predictors). This means that if there are seven predictors (i.e., independent variables), the minimum sample size would be 50 + 8 x 7 = 106. In this study, only 15 test passages were used and therefore a multiple regression analysis for developing a translation difficulty model could not be carried out.
To develop such a model, a researcher needs to have a large number of participants evaluate the translation difficulty level of over 100 passages and have a mean
Table 4. Mean translation difficulty scores of the 15 passages
(or agreed-upon) translation difficulty score for each passage. If the participants are asked to provide a translation difficulty score for each passage immediately after they finish the translation, few researchers would be able to afford to work on this topic.
However, if there is a way to get a translation difficulty score from each participant for each passage without translating it, then it would be much easier. The research question is whether a participant can predict the translation difficulty level of a passage.
A backward stepwise multiple regression was carried out using Statgraphics Centurion (version 16.1) to investigate the best pattern of variables for predicting the level of translation difficulty of a text by each participant. The predictors (i.e., independent variables) taken into account included (1) Self-predicted level of translation difficulty (by the pre-translation rating), 2) Average sentence length, (3) Number of unique words, (4) Average number of syllables, (5) Number of complex (iii+ syllable) words, (6) Number of unique iii+ syllable words, and (7) Number of unique long words. The occurrences of these language factors in each passage were counted by Readability Studio.
The result showed that the only independent variable that was selected for entry into the analysis turned out to be the participants’ self-predicted translation difficulty level by pre-translation ratings. The other 6 independent variables were not included as they were not significant, independent predictors of translation difficulty level.
The equation of the fitted multiple linear regression model is:
T = 1.81306 + 0.549266*P
Where T refers to the actual translation difficulty score for the participant and P is the participant’s self-predicted level of translation difficulty (by the pre-translation rating).
An ANOVA test showed that there was a statistically significant relationship between translation difficulty score and self-predicted level of translation difficulty at the 95.0% confidence level. The adjusted R-squared statistic was .462. This means self-predicted level of translation difficulty explained 46.20% of the variance in each participant’s translation difficulty score. In multiple regression, the guideline for effect sizes (i.e., R-squared) provided by Cohen (1988: 478) is that .02, .13, and .26 are for small, moderate, and large effect sizes, respectively. Therefore, .462 indicates a large effect size. Figure 7 displays the scatterplot of the two variables.
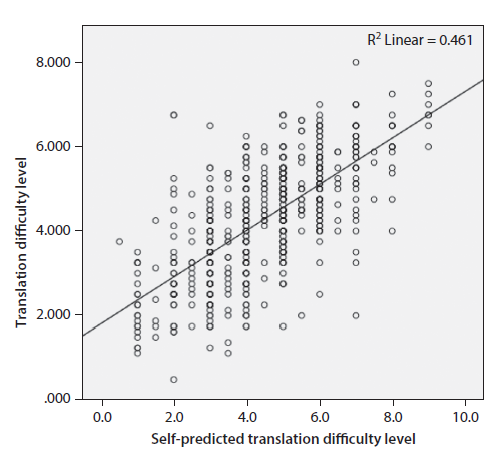
Figure 7. Relationship between self-predicted translation difficulty level and the actual translation difficulty level
This means that if a participant predicts the translation difficulty score of a passage to 6.5 on a scale of 0 to 10 with 0 being not difficult at all and 10 being extremely difficult, the actual translation difficulty level for her will probably be 5.38 (1.81306+0.549266 x 6.5 = 5.383289).
4. Discussion
The purpose of this study was to explore ways to measure the translation difficulty level of source texts (English in this case). It was guided by five research questions. Here is a summary of the main findings.
- NASA Task Load Index (TLX), a multidimensional scale for measuring subjective workload, can be used to assess translation difficulty for the translator, and it was proved to be reliable in this study.
- Accuracy (i.e., translation quality score in this case), which is a commonly used performance measure for deriving an index of difficulty, was found to be an unreliable indicator of the level of translation difficulty as measured by NASA-TLX.
- Speed (i.e., time-on-task in this case), which is also a commonly used performance measure for deriving an index of difficulty, was found to be significantly, but weakly, related to the level of translation difficulty as measured by NASA-TLX.
- The readability score of a text as measured by Flesch Reading Ease formula was found to be weakly correlated with its translation difficulty score as measured by NASA-TLX. That is, a text’s readability only partially accounts for its level of translation difficulty.
- A formula was developed using multiple regression to predict a text’s level of translation difficulty (as measured by NASA-TLX) for a translator by using the translator’s pre-translation rating. This will facilitate future studies on developing a translation difficulty formula.
In the following paragraphs, we will tie together results from the five research questions into several key points, then address some limitations of the study and offer some suggestions for further research.
4.1 Readability formulas and translation difficulty
Readability formulas typically use one to three factors, and vocabulary difficulty and sentence length are the strongest indexes of readability. Compared with sentence length, vocabulary difficulty (i.e., word familiarity or word length) plays
a more important role. This is consistent with the result of one post-translation survey question, that is, which of the following aspects in source text comprehension created more problems for you? The result indicated that among the three choices (i.e., lack of background knowledge, difficult words, long sentences) “difficult words” presented the greatest difficulty to the participants, followed by “long sentences.”
This study found that as the readability level increased, translation difficulty score tended to decrease. However, the association between the two variables was weak. In other words, readability formulas cannot predict well the translation difficulty level of a text. There are reasons for this.
First, readability formulas are for measuring the readability of a text, and involve only reading comprehension. By contrast, translation competence includes such subcompetences as source language competence, transfer competence, and target language competence. Some participants commented in the survey that they had no difficulty understanding the source texts, but had considerable trouble conveying the source text idea in idiomatic Chinese. It can be inferred from these that deficiency in transfer competence can cause considerable difficulty to the translator.
Second, mainstream readability formulas were all developed in the USA, and the readers are English native speakers. It is still an open question whether they work well for Chinese ESL learners. For instance, English teachers teach their students formal grammar and standard vocabulary, and usually do not teach colloquial, vernacular, informal English (e.g., slang) (Zimmerman 2010). Many Chinese ESL learners would have difficulty understanding the informal idiomatic expressions like “Here we go again,” and they would not find help in a regular English-Chinese dictionary. Yet, these idiomatic expressions present no difficulty to native English speakers and as they use simple words, readability formulas rate them as “easy.” Obviously, more empirical research is needed to determine whether these mainstream readability formulas work for Chinese ESL learners or a new readability formula needs to be developed for them.
4.2 Good translators and poor translators
Participants in this study included first-year graduate students and third-year undergraduate students. People would assume that the former group will outperform the latter. But the fact is that overall, undergraduate students outperformed graduate students. This unexpected result needs to be reflected on, although similar findings have been found in the fields of reading and writing. For instance, in Carrell and Connor’s (1991) study, which involved twenty-three undergraduate and ten graduate students enrolled in an English as a Second Language Program in
an American university, the undergraduates significantly outscored the graduate students in reading and writing tests.
In this study, the participants were from two universities. All undergraduate students were from a university which had a very strong foreign language/translation program. Twelve graduate students were also from that university, and the rest from another university which had a moderately strong translation program. That is, students from the better program were probably academically more able than their counterparts from the other program. This may partially account for this result.
As mentioned above, translation competence includes source language competence, transfer competence, and target language competence. In this case, target language competence refers to participants’ competence in Chinese. Do graduate students have a better competence in Chinese than do undergraduate students? The answer is negative, as Chinese college students (especially graduate students) in foreign language programs usually do not take courses in Chinese language.
As for the fact that the graduate students had taken more courses in translation (especially in translation theories) than the undergraduate students, Pym (2010, 4) says that “there is no empirical evidence” for the claim that “a translator who knows about different theories will work better than one who knows nothing about them,” because “[a]ll translators theorize, not just the ones who can express their theories in technical terms.”
This result has implications for translation process research. Translation process researchers tend to take professional translators as ‘experts’ and translation students as ‘novices’. For instance, the PACTE group (2005, 611) defines expert translators as “translators with at least 6 years of experience in a variety of fields for whom translation is their main professional activity and provides at least 70% of their income.” However, “translation expert” is a misnomer.
To become an expert in an area, one needs deliberate practice, i.e., engaging in tasks with goals that exceed the current level of performance. It occurs only under the following conditions, when (a) there is a well-defined task, (b) the task is of appropriate difficulty for the individual, (c) there is informative feedback, and (d) there are opportunities for repetition and the correction of errors (Shreve 2002, 29). Process researchers have already found a phenomenon which has to do with this expertise rule. By comparing her former TAP study (1990) and Gerloff ’s TAP study (I988), Jääskeläinen (1996) concluded that (1) translation does not always get easier as professional experience increases, and (2) professional translators do not always succeed better than non-professionals. Kiraly (1995, 111) explained this phenomenon:
As the translation student moves further along the evolutionary path from [novice] translator to high quality professional translator, the skills that are required are (a) less likely to be acquired by repeated practice, (b) less likely to develop naturally without specific training and pedagogical intervention, and c) more likely to involve translation quality at levels beyond that of mere semantic and syntactic correctness.
In real life, few professional translators get systematic feedback from the clients or proofreaders (Englund Dimitrova 2005). Thus, the quality of their translation manifests no sign of improvement. In addition, source texts involve different text types and subject matters, and translators usually specialize in only a few domains. From this perspective, this is no “translation expert.” Translation process researchers need to distinguish between good translators and poor translators by their performance rather than by their experience.
4.3 Workload and performance
As mentioned at the beginning of this article, speed (i.e., time-on-task) and accuracy (i.e., translation quality score in this case), which are performance measures, are two commonly used workload indicators. The two will be discussed below.
In expertise studies, it is a consensus that experts can generate the best solution faster and more accurately than non-experts. In the field of translation, there have been mixed findings regarding whether professional translators translate faster than non-professionals (see Tirkkonen-Condit 1987; Jääskeläinen 1999). This study found that time spent on a translation and translation quality score were not significantly related. High scorers and low scorers could not be distinguished by their time-on-task.
From the problem-solving perspective, the reason may be that translation involves solving ill-defined problems (Englund Dimitrova 2005). There are welldefined problems and ill-defined problems. Well-defined problems are those problems whose goals, solution paths, and obstacles to solution are clear based on the information given while ill-defined problems are characterized by no single correct solution and lack of a clear problem statement as well (Davidson and Sternberg 2003, 4). Based on how problems are found, Getzels (1982, quoted in Pretz et al. 2003) classified problems into three types: those that are presented, those that are discovered, and those that are created. A presented problem does not need to be recognized; it just needs to be solved. A discovered problem needs to be recognized first.
When working on the same source text, translators are not solving the same problems. For instance, Jääskeläinen (1999) found that non-professionals spent less time on the task than professionals, and she attributes this result to novices’
presupposed ignorance of potential translation problems (e.g., the cultural connotation of a word). In Tirkkonen-Condit’s two-subject experiment (1987), the mature student spent less time on the process but identified more problems, i.e., was more sensitized to potential problems but also more efficient in problemsolving. Texts differ in how many problems (e.g., caused by unfamiliar allusions) are implicit and need to be discovered. In L2-L1 translation, this requires that the translator have a good understanding of the source text. In addition, as Pym (2003, 489) says, good translators excel in generating a series of more than one viable target text for a source text and selecting only one viable target text from them quickly and with justified confidence. Poor translators, by contrast, generate fewer equivalents at the above-phrase level in the target language and engage in less decision making.
Of course, one factor that needs to be taken into account is the translation difficulty level of the source text, which is related to how many potential problems a translator needs to solve. It was found in this study that time-on-task was weakly related to workload (i.e., translation difficulty level). That is to say, as translation difficulty level increases, translators need to spend more time on the translation. This makes sense. But as translators have different goals, namely, expectations regarding translation quality, the time they would spend on the translation varies. This might explain why the correlation between time-on-task and workload was weak.
4.4 Limitations of this study and suggestions for further study
Although this study has added to our understanding of how to measure translation difficulty, a number of unanswered questions still remain.
This study used fifteen test passages with an average length of 125 words. Although most readability formulas (e.g., Flesch, Fog, SMOG) work with passages shorter than 300 words (Bastable 2008, 258), it has been recommended (e.g., by Readability Studio) that passages longer than 300 words be used so that the selections would be more representative of the texts. Of course, using longer test passages would come with the disadvantage of a smaller sample size of texts.
Text type is a very important factor in translation difficulty. In this study, it was a control variable, and only informational and expository texts were adopted. It would be interesting to investigate how text type influences the level of translation difficulty. For instance, translating literary and non-literary texts might involve solving different kinds of problems. There might be more one-to-one equivalence situations in non-literary translation than in literary translation, whereas in literary translation translators might be more engaged in selecting one optimal solution from several renditions than in non-literary translation. Descriptive and
persuasive texts might also have differences in terms of translation difficulty. It has been found that descriptive texts are easier to read or write than persuasive texts (Carrell and Connor 1991).
On a related note, when selecting test passages, researchers should avoid those that happen to belong to a domain that some participants routinely work in. Generally speaking, if a novice/poor translator thinks passage A is more difficult to translate than passage B, a professional/good translator will probably agree. This is the case for generalist translators (in contrast to specialized translators). For professional translators who routinely work in a domain (e.g., legal translation), things might be different. For instance, a professional generalist translator thinks passage A (a press release from a bank) is easier to translate than passage B (a legal contract). A translator who specializes in legal translation might think otherwise. This would complicate the results.
In this study, participants were asked to translate on paper. In the professional world, almost all translators work on a computer. The testing mode (i.e., paperbased versus computer-based assessment) might have an effect on their performance and translation difficulty evaluation. To date, there have been many studies examining the comparability of scores by paper-based and computer-based tests in other fields. For instance, Higgins et al. (2005) found no significant differences in reading comprehension scores across testing modes. One difference between paper-based versus computer-based translation would be that translators working on a computer may have access to the Internet and electronic dictionaries. For instance, Powerword (by Kingsoft), a widely used electronic dictionary software program in China, contains over 150 authorized English-Chinese dictionaries (including several Oxford dictionaries). Looking up words would be much easier. In addition, translating on a computer will reduce considerably the numbers of typos and punctuation errors.
Having participants translate on computers also facilitates recording the translation process with screen recording or keystroke logging software tools. Besides translation scores and participants’ self-evaluation of translation difficulty, translation process data would be available for analysis. The researcher can locate places that have caused problems to the participants. Together with the use of think-aloud protocols, it might also help graders determine whether or not an error reflects a deficiency in source language competence, transfer competence, or target language competence. It should be noted that translation problems do not necessarily manifest themselves as translation errors.
NASA-TLX has two versions: the paper-and-pencil version and computer version. The former was used in this study. The computer version contains the original six subscales, and allows the user to assign a weight to each subscale through 15 possible pairwise comparisons of the subscales. There are studies (e.g., Moroney et
al. 1992) indicating that assigning weights is unnecessary. Still, it would be useful to verify this conclusion for translation difficulty research.
In order to develop a translation difficulty formula, the text features that can best predict the translation difficulty level of a text need to be combined. There is a need to recognize these text features. For instance, passive sentences might create more problems in English-Chinese translation than do active sentences. In translation process research, researchers usually have participants translate test passages, and they select test passages based on passage length, text type, and subject matter. It is hard to find test passages that contain a great many specific translation problems (or text features) that the researcher might be interested in. For this kind of research questions, a group of sentences rather than whole passages may be more suitable.
Because of limited sample size, this study did not produce a translation difficulty formula. However, a formula was produced that will contribute to our ability to derive a translation difficulty score from each participant for each test passage without translating it. This will facilitate the next stage, in which future researchers have a large number of participants evaluate the translation difficulty level of over 100 passages with a view to developing such a translation difficulty formula.
Research in translation difficulty can contribute greatly to our understanding of the translation process in terms of relationships between text characteristics, translator behaviors, and translation quality. Finding a way to measure translation difficulty will help translation teachers prepare properly leveled passages for translation exercises and language service providers have a better idea of the translation difficulty level of the materials.
References
Anagnostou, Nikolaos K., and George R.S. Weir. 2007. “From Corpus-Based Collocation Frequencies to Readability Measure.” In Texts, Textbooks and Readability, ed. by George R. S. Weir, and Toshiaki Ozasa, 34–48. Glasgow: University of Strathclyde Publishing.
Baker, Mona. (1992) 2011. In Other Words: A Coursebook on Translation. London: Routledge.
Bastable, Susan Bacorn. 2008. Nurse as Educator: Principles of Teaching and Learning for Nursing Practice. 3rd ed. London: Jones and Bartlett.
Campbell, Stuart, and Sandra Hale. 2003. “Translation and Interpreting Assessment in the Context of Educational Measurement.” In Translation Today: Trends and Perspectives, ed. by Gunilla M. Anderman, and Margaret Rogers, 205–224. Clevedon: Multilingual Matters.
———. 1999. “What Makes a Text Difficult to Translate?” http://www.latrobe.edu.au/alaa/proceed/camphale.html (accessed Nov. 1, 2009).
Carrell, Patricia L., and Ulla Connor. 1991. “Reading and Writing Descriptive and Persuasive Texts.” The Modern Language Journal 75 (3): 314–324.
Chall, Jeanne Sternlicht, and Edgar Dale. 1995. Readability Revisited: The New Dale-Chall Readability Formula.Cambridge, MA: Brookline Books.
Chen, Peter Y., and Autumn D. Krauss. 2004a. “Internal Reliability.” In The Sage Encyclopedia of Social Science Research Methods, ed. by Michael S. Lewis-Beck, Alan Bryman, and Tim Futing Liao, 501–502. Thousand Oaks, CA: Sage.
———. 2004b. “Reliability.” In The Sage Encyclopedia of Social Science Research Methods, ed. by Michael S. Lewis-Beck, Alan Bryman, and Tim Futing Liao, 952–956. Thousand Oaks, CA: Sage.
Cohen, Jacob. 1988. Statistical Power Analysis for the Behavioral Sciences. 2nd ed. Hillsdale, NJ: L. Erlbaum Associates.
Cronbach, Lee J. 1951. “Coefficient Alpha and the Internal Structure of Tests.” Psychometrika 16 (3): 297–334.
Dahl, Östen. 2004. The Growth and Maintenance of Linguistic Complexity. Amsterdam: John Benjamins.
Davidson, Janet E., and Robert J. Sternberg, eds. 2003. The Psychology of Problem Solving. Cambridge: Cambridge University Press.
Dragsted, B. 2004. Segmentation in Translation and Translation Memory Systems: An Empirical Investigation of Cognitive Segmentation and Effects of Integrating a Tm-System into the Translation Process. PhD diss. Copenhagen Business School.
DuBay, William H. 2004. “The Principles of Readability.” http://www.impact-information.com/ impactinfo/readability02.pdf (accessed November 1, 2009).
Englund Dimitrova, Birgitta. 2005. Expertise and Explicitation in the Translation Process. Amsterdam: John Benjamins.
Feldt, Leonard S. 1961. “The Use of Extreme Groups to Test for the Presence of a Relationship.” Psychometrika 26 (3): 307–316.
Gerloff, Pamela. 1988. From French to English: A Look at the Translation Process in Students, Bilinguals, and Professional Translators. PhD. diss. Harvard University.
Green, Samuel B. 1991. “How Many Subjects Does It Take to Do a Regression Analysis.” Multivariate Behavioral Research 26 (3): 499–510.
Hale, Sandra and Stuart Campbell. 2002. “The Interaction between Text Difficulty and Translation Accuracy.” Babel 48 (1): 14–33.
Hart, Sandra G., and Lowell E. Staveland. 1988. “Development of Nasa-Tlx (Task Load Index): Results of Empirical and Theoretical Research.” In Human Mental Workload, ed. by Peter A. Hancock, and Najmedin Meshkati, 139–183. Amsterdam: North-Holland.
Higgins, Jennifer, Michael Russell and Thomas Hoffmann. 2005.“Examining the Effect of Computer-Based Passage Presentation on Reading Test Performance.” The Journal of Technology, Learning, and Assessment 4. http://www.jtla.org.
House, Juliane. 2009. “Quality.” In Routledge Encyclopedia of Translation Studies, ed. by Mona Baker, and Gabriela Saldanha, 222–225. London: Routledge.
Hoyt, Linda, Margaret E. Mooney, and Brenda Parkes, eds. 2003. Exploring Informational Texts: From Theory to Practice. Portsmouth, NH: Heinemann.
Jääskeläinen, Riitta. 1990. Features of Successful Translation Processes: A Think-aloud Protocol Study. Unpublished licentiate thesis, University of Joensuu, Savonlinna School of Translation Studies.
———. 1996. “Hard Work Will Bear Beautiful Fruit. A Comparison of Two Think-Aloud Protocol Studies.” Meta 41 (1): 60–74.
———. 1999. Tapping the Process: An Explorative Study of the Cognitive and Affective Factors Involved in Translating. University of Joensuu Publications in the Humanities 22. Joensuu: University of Joensuu.
Jensen, Kristian T.H. 2009. “Indicators of Text Complexity.” Copenhagen Studies in Language 37: 61–80.
Jex, Henry. R. 1988. “Measuring Mental Workload: Problems, Progress, and Promises.” In Human Mental Workload, Advances in Psychology 52, ed. by Peter. A. Hancock, and Najmedin Meshkati, 5–38. Amsterdam: North-Holland.
Kelley, Truman L. 1939. “The Selection of Upper and Lower Groups for the Validation of Test Items.” Journal of Educational Psychology 30: 17–24.
Kiraly, Donald Charles. 1995. Pathways to Translation: From Process to Pedagogy. Kent, OH: Kent State University Press.
Krings, Hans P. 2001. Repairing Texts: Empirical Investigations of Machine Translation PostEditing Processes. Translated by Geoffrey Koby, Gregory Shreve, Katjz Mischerikow, and Sarah Litzer. Kent, OH: Kent State University Press.
Liu, Minhua, and Yu-Hsien Chiu. 2009. “Assessing Source Material Difficulty for Consecutive Interpreting: Quantifiable Measures and Holistic Judgment.” Interpreting 11 (2): 244–266.
Moray, Neville. 1979. Mental Workload: Its Theory and Measurement. New York: Plenum Press.
Moroney, William F., David W. Biers, F. Thomas Eggemeier, and Jennifer A. Mitchell. 1992. “A Comparison of Two Scoring Procedures with the Nasa Task Load Index in a Simulated Flight Task.” In Proceedings of the IEEE 1992 National Aerospace and Electronics Conference Naecon 1992, Dayton, 18–22 May 1992, 734–740.
Nord, Christiane. 2005. Text Analysis in Translation: Theory, Methodology, and Didactic Application of a Model for Translation-Oriented Text Analysis. 2nd ed. Amsterdam: Rodopi.
Nunnally, Jum C. 1978. Psychometric Theory. 2nd ed. New York: McGraw-Hill.
O’Donnell, Robert D., and F. Thomas Eggemeier. 1986. “Workload Assessment Methodology.” In Handbook of Perception and Human Performance. Vol. 2: Cognitive Processes and Performance, ed. by Kenneth R. Boff, Lloyd Kaufman, and James P. Thomas, 42/41–42/49. New York: Wiley.
Paas, Fred G. 1992. “Training Strategies for Attaining Transfer of Problem-Solving Skill in Statistics: A Cognitive-Load Approach.” Journal of Educational Psychology 84 (4): 429–434.
PACTE. 2005. “Investigating Translation Competence: Conceptual and Methodological Issues.” Meta 50 (2): 609–619.
Pallant, Julie. 2011. Spss Survival Manual. 4th ed. Crows Nest (Australia): Allen & Unwin. Pedhazur, Elazar J. 1997. Multiple Regression in Behavioral Research: Explanation and Prediction. 3rd ed. Fort Worth, TX: Wadsworth/Thomson Learning.
Preacher, Kristopher J., Derek D. Rucker, Robert C. MacCallum, and W. Alan Nicewander. 2005. “Use of the Extreme Groups Approach: A Critical Reexamination and New Recommendations.” Psychological Methods 10 (2): 178–192.
Pretz, Jean E., Adam J. Naples, and Robert J. Sternberg. 2003. “Recognizing, Defining, and Representing Problems.” In The Psychology of Problem Solving, ed. by Janet E. Davidson, and Robert J. Sternberg, 3–30. Cambridge: Cambridge University Press.
Pym, Anthony. 2003. “Redefining Translation Competence in an Electronic Age: In Defence of a Minimalist Approach.” Meta 48 (4): 481–497.
———. 2010. Exploring Translation Theories. London: Routledge.
Rayner, Keith, and Alexander Pollatsek. 1989. The Psychology of Reading. Hillsdale, NJ: Lawrence Erlbaum.
Shreve, Gregory M. 2002. “Knowing Translation: Cognitive and Experiential Aspects of Translation Expertise from the Perspective of Expertise Studies.” In Translation Studies: Perspectives on an Emerging Discipline, ed. by Alessandra Riccardi, 150–173. Cambridge: Cambridge University Press.
Sweller, John, Paul L. Ayres, and Slava Kalyuga. 2011. Cognitive Load Theory. New York: Springer. Taylor, Wilson L. 1953. “‘Cloze Procedure’: A New Tool for Measuring Readability.” Journalism Quarterly 30: 415–433.
Tirkkonen-Condit, Sonja. 1987. “Think-Aloud Protocols in the Study of the Translation Process.” In CDEF 86: Papers from the Conference of Departments of English in Finland, ed. by Heikki Nyyssönen, Riitta Kataja, and Vesa Komulainen, 39–49. Oulu: University of Oulu.
Tsang, Pamela S. 2006. “Mental Workload.” In International Encyclopedia of Ergonomics and Human Factors, ed. by Waldemar Karwowski, 809–813. Boca Raton, FL: CRC/Taylor & Francis.
Vidulich, Michael A. 1988. “The Cognitive Psychology of Subjective Mental Workload.” In Human Mental Workload, ed. by Peter A. Hancock, and Najmedin Meshkati, 219–229. Amsterdam: North-Holland.
Wilson, Glenn F.. and F. Thomas Eggemeier. 2006. “Mental Workload Measurement.” In International Encyclopedia of Ergonomics and Human Factors, ed. by Waldemar Karwowski, 814–817. Boca Raton, FL: CRC/Taylor & Francis.
Wilss, Wolfram. 1982. The Science of Translation: Problems and Methods. Tübinger Beitraäge zur Linguistik. Tübingen: G. Narr.
Zamanian, Mostafa, and Pooneh Heydari. 2012. “Readability of Texts: State of the Art.” Theory and Practice in Language Studies 2 (1): 43–53.
Zimmerman, Lynn W. 2010. ESL, EFL, and Bilingual Education: Exploring Historical, Sociocultural, Linguistic, and Instructional Foundations. Charlotte, NC: Information Age Pub.
Zipf, George Kingsley. 1935. The Psycho-Biology of Language: An Introduction to Dynamic Philology. Boston: Houghton Mifflin.
Appendixes
A. The Post-translation Questionnaire
1. How much time did you spend on this translation?
minutes (including revision time)
2. Which of the following was more difficult for you? Please tick the appropriate box.
□ Source text comprehension
□ Reverbalization in the target language
□ The two were equally difficult.
3. Which of the following aspects in source text comprehension created more problems for you? Please rank the items using 1, 2, and 3, with 1 being the most difficult.
□ Lack of background knowledge
□ Difficult words
□ Long sentences
□ Others, please specify
4. Which of the following aspects in reverbalization created more problems for you? Please rank the items using 1, 2, and 3, with 1 being the most difficult.
□ Word level
□ Sentence level
□ Style
□ Others, please specify
B. The Adapted NASA Task Load Index for Measuring Translation Difficulty